Project Overview
For this project I was tasked with tracking my waste disposal for one week and then visualize the data in a unique way. I was able apply what I learned in class to conduct primary research, data collection, data filtering, and data analysis. I then was able to discern patterns and relationships in small-sized qualitative and quantitative data with visualization methods.
Class Explorations
For class, I did a weekly assignment that challenged me to explore different visualization methods.
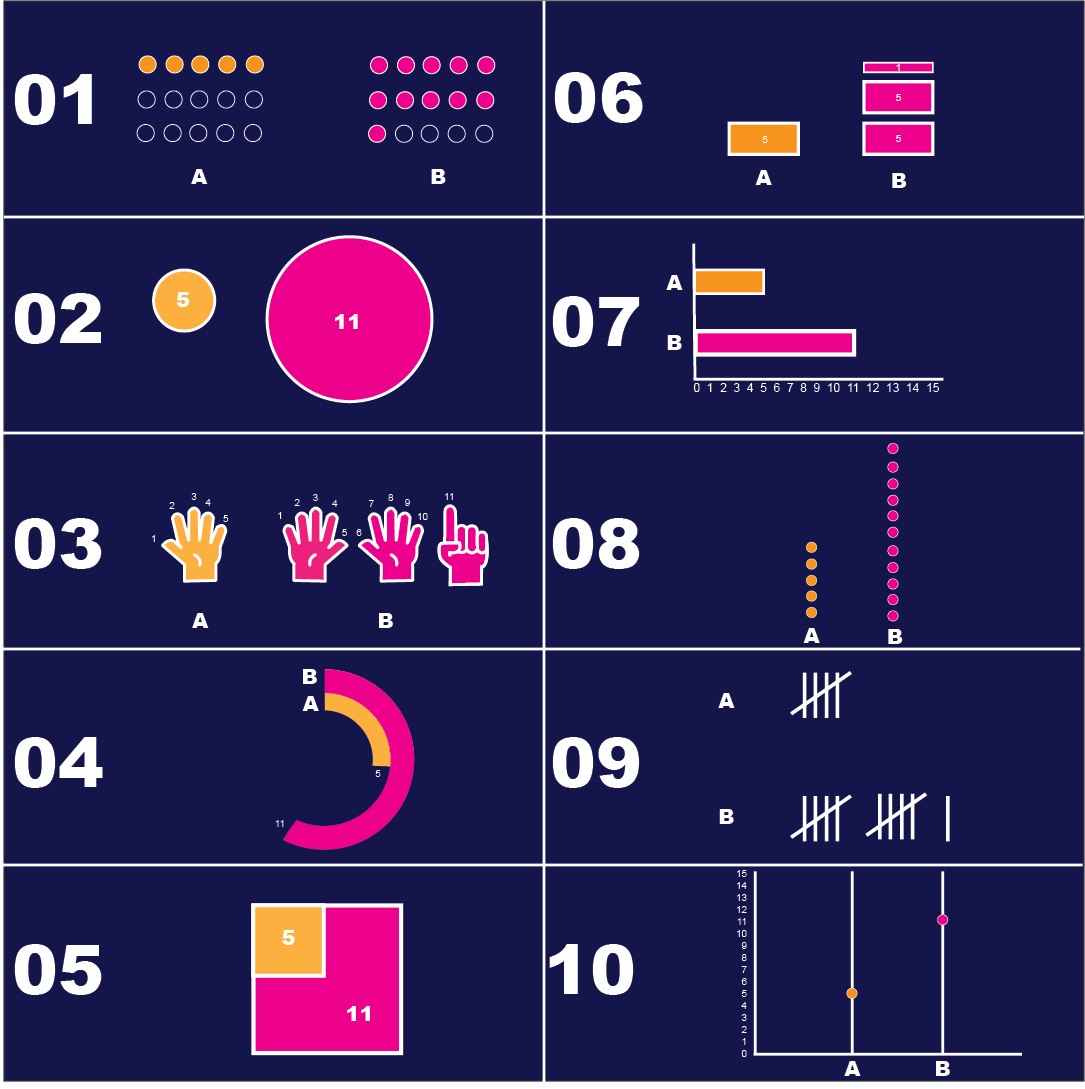
How many ways can you visualize 2 numbers?
Active Looking
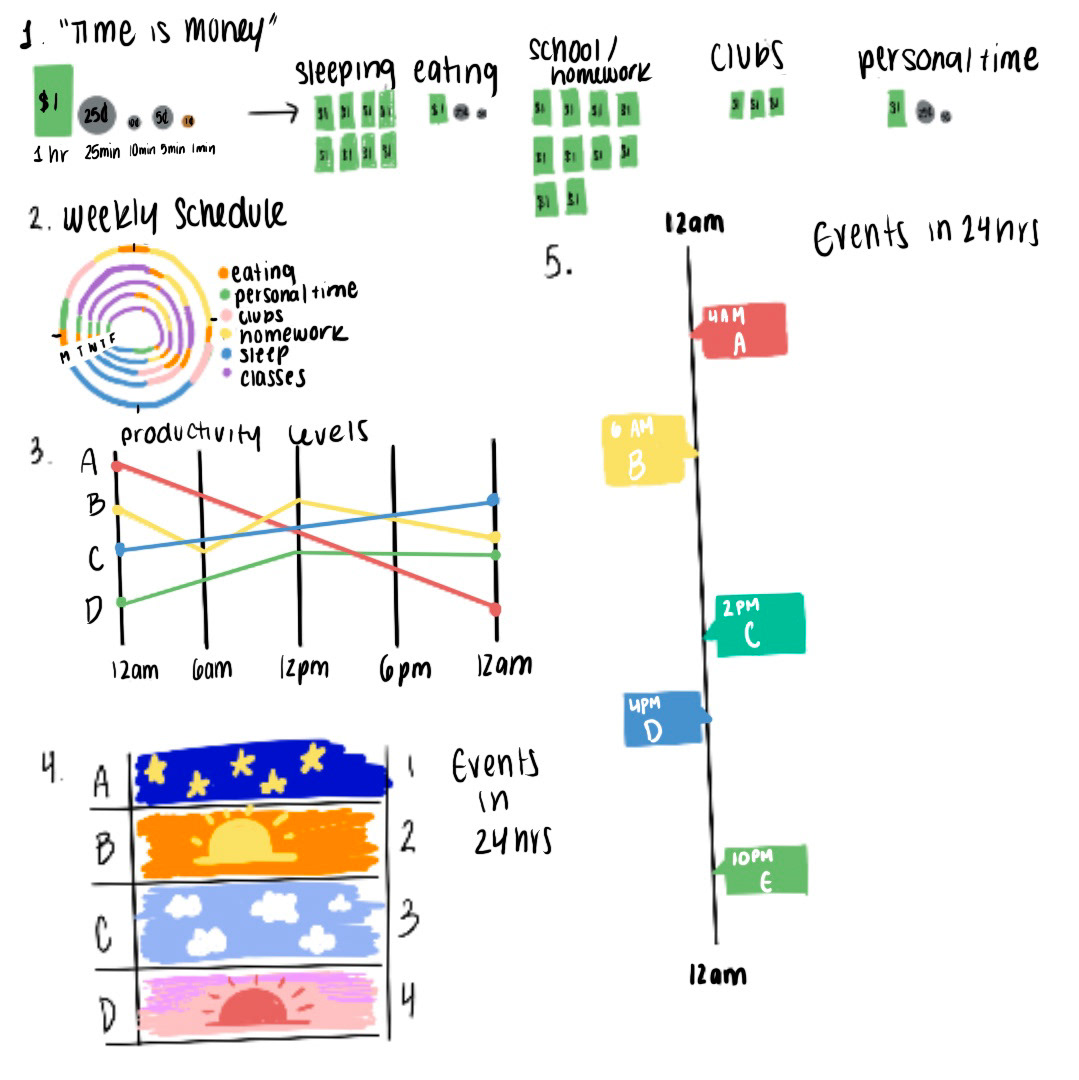
Timeline
Vector Graph
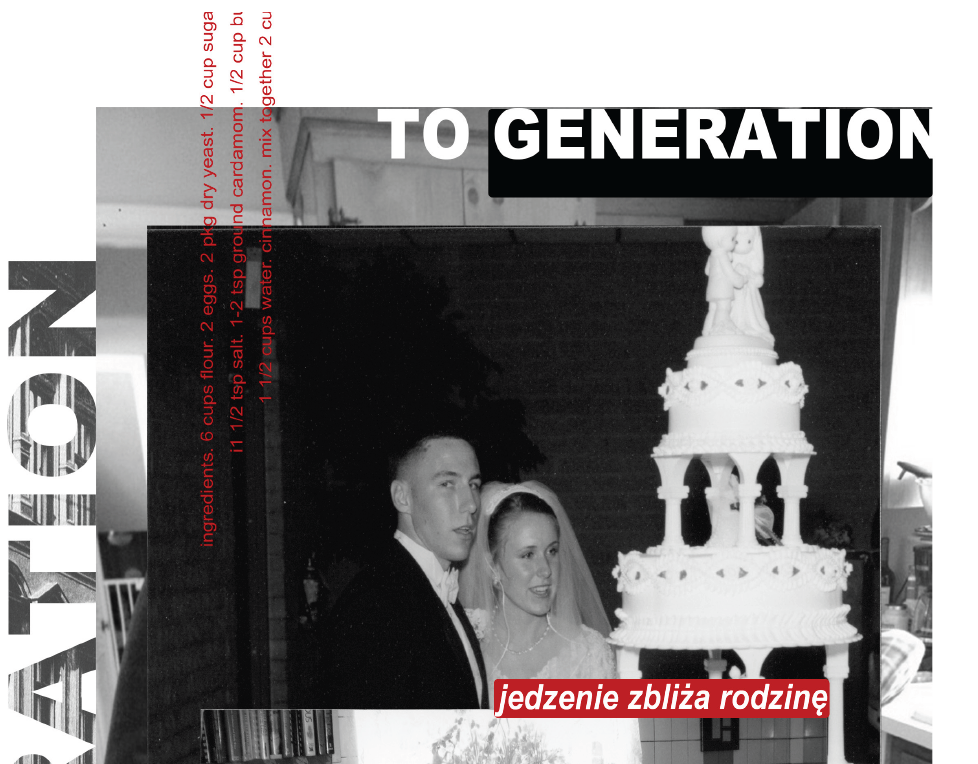
Visual Metaphor
Research
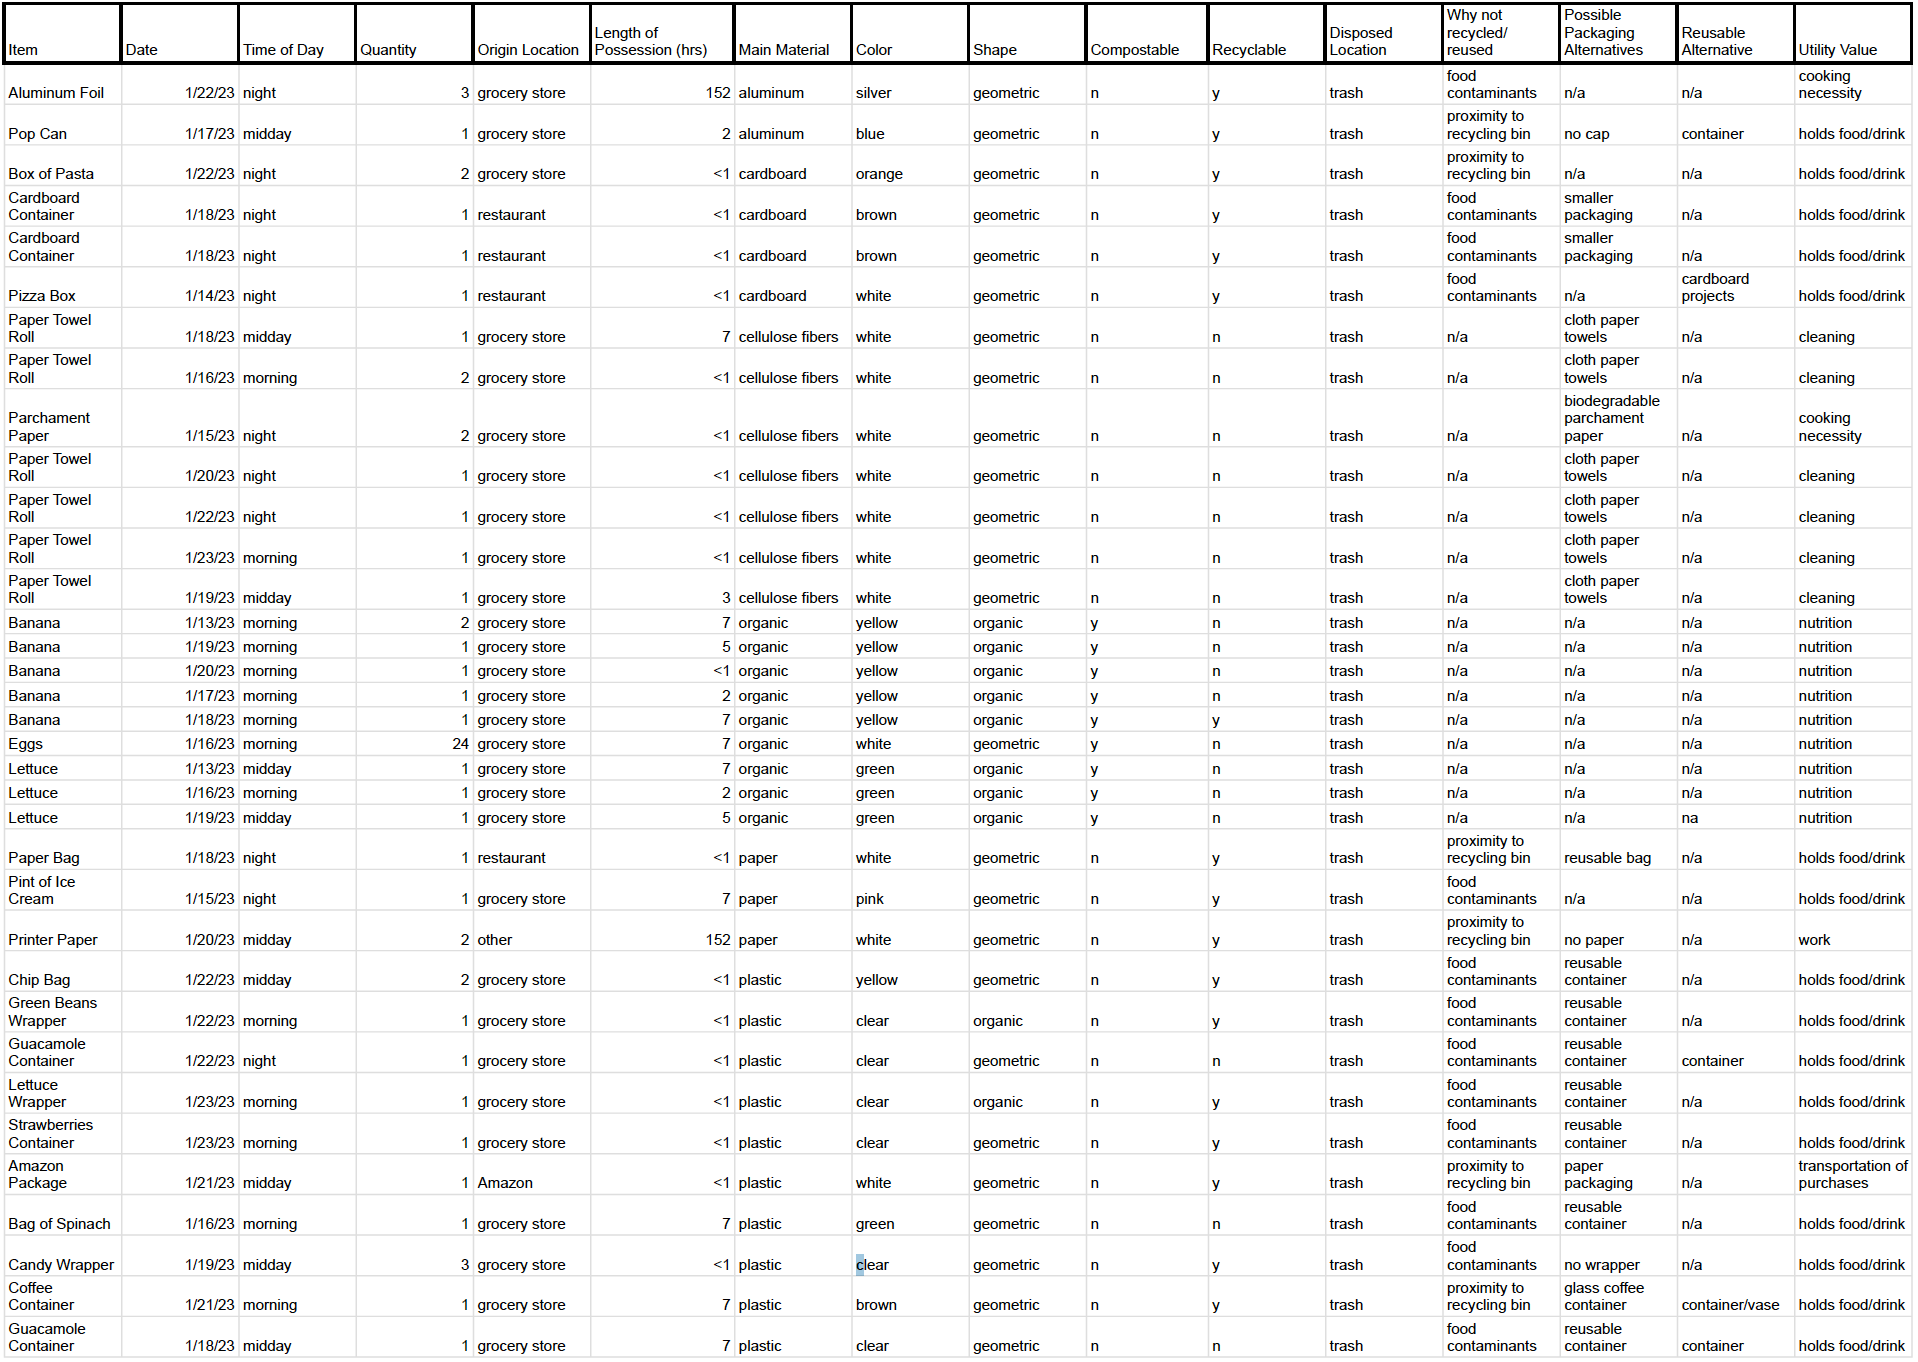
Primary Research:
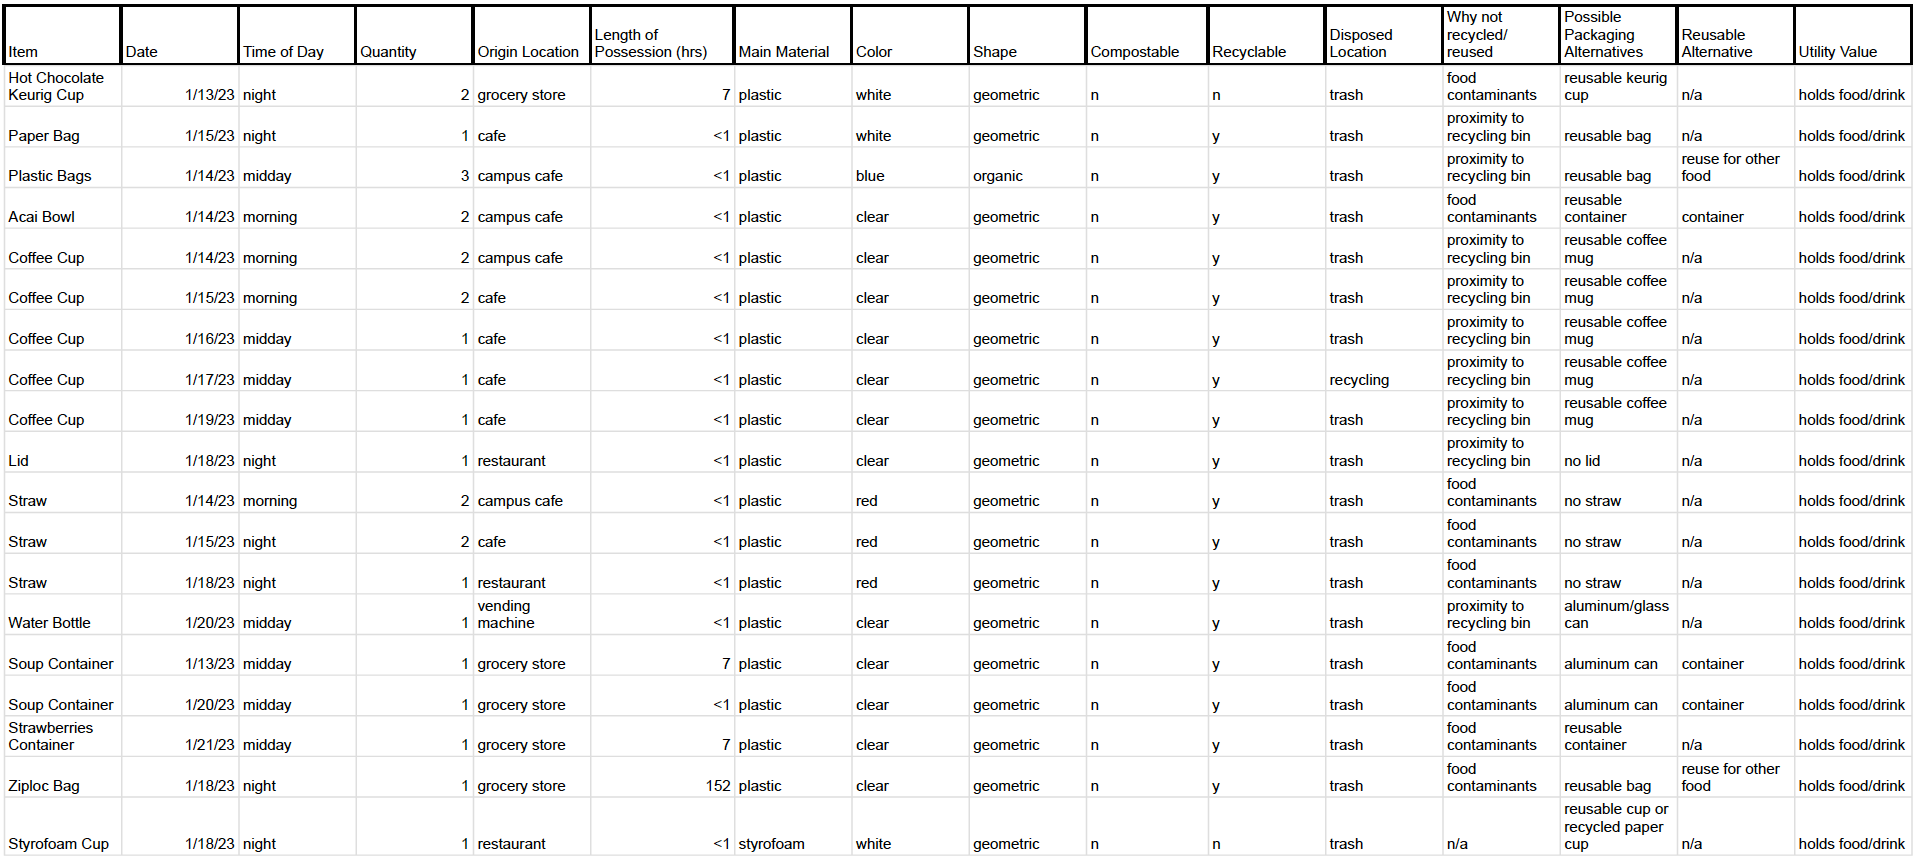
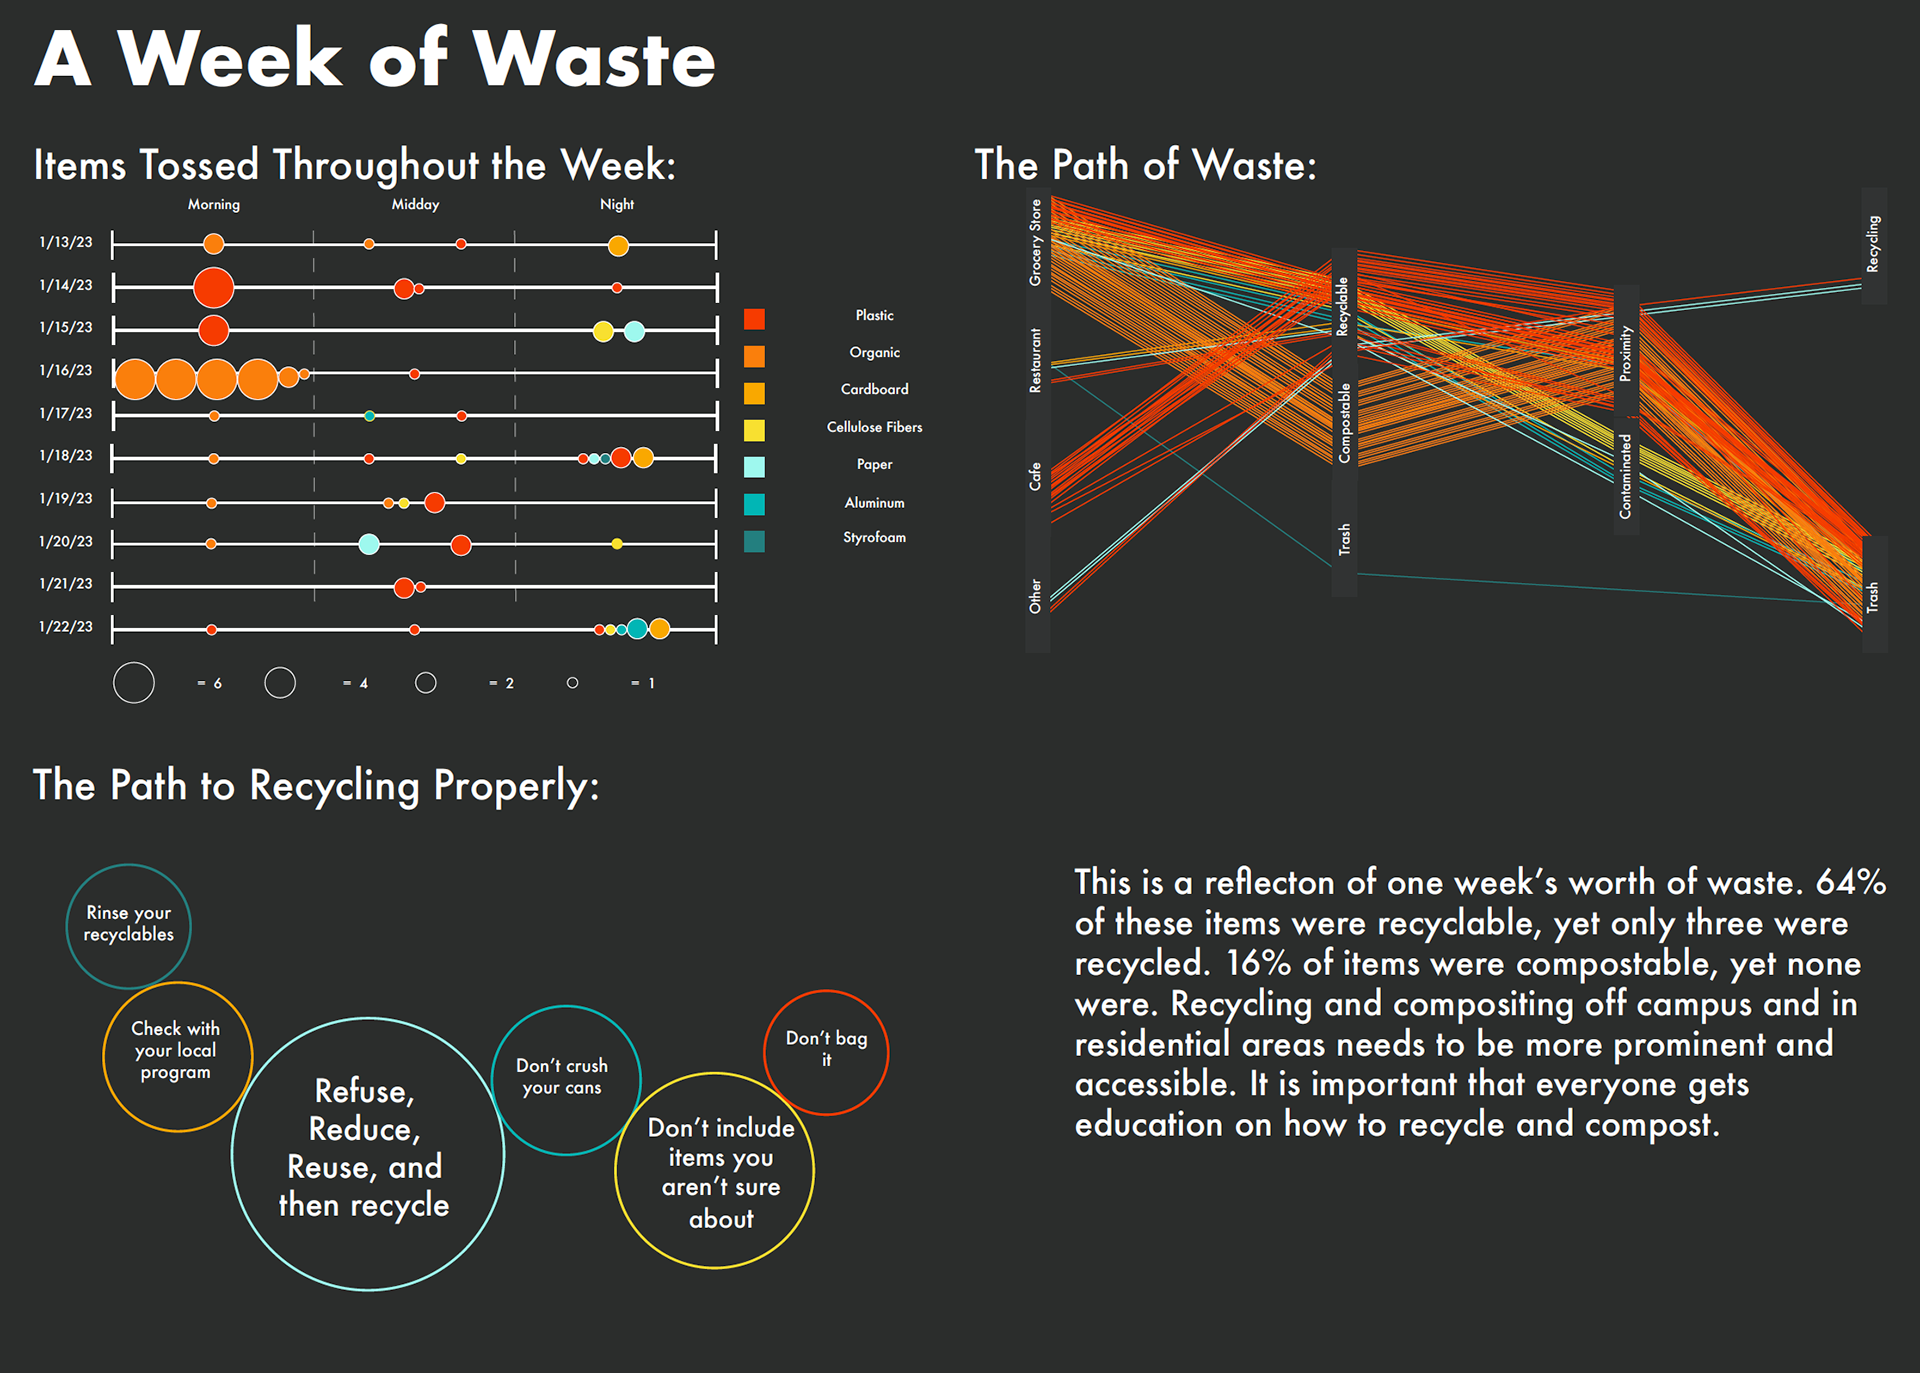
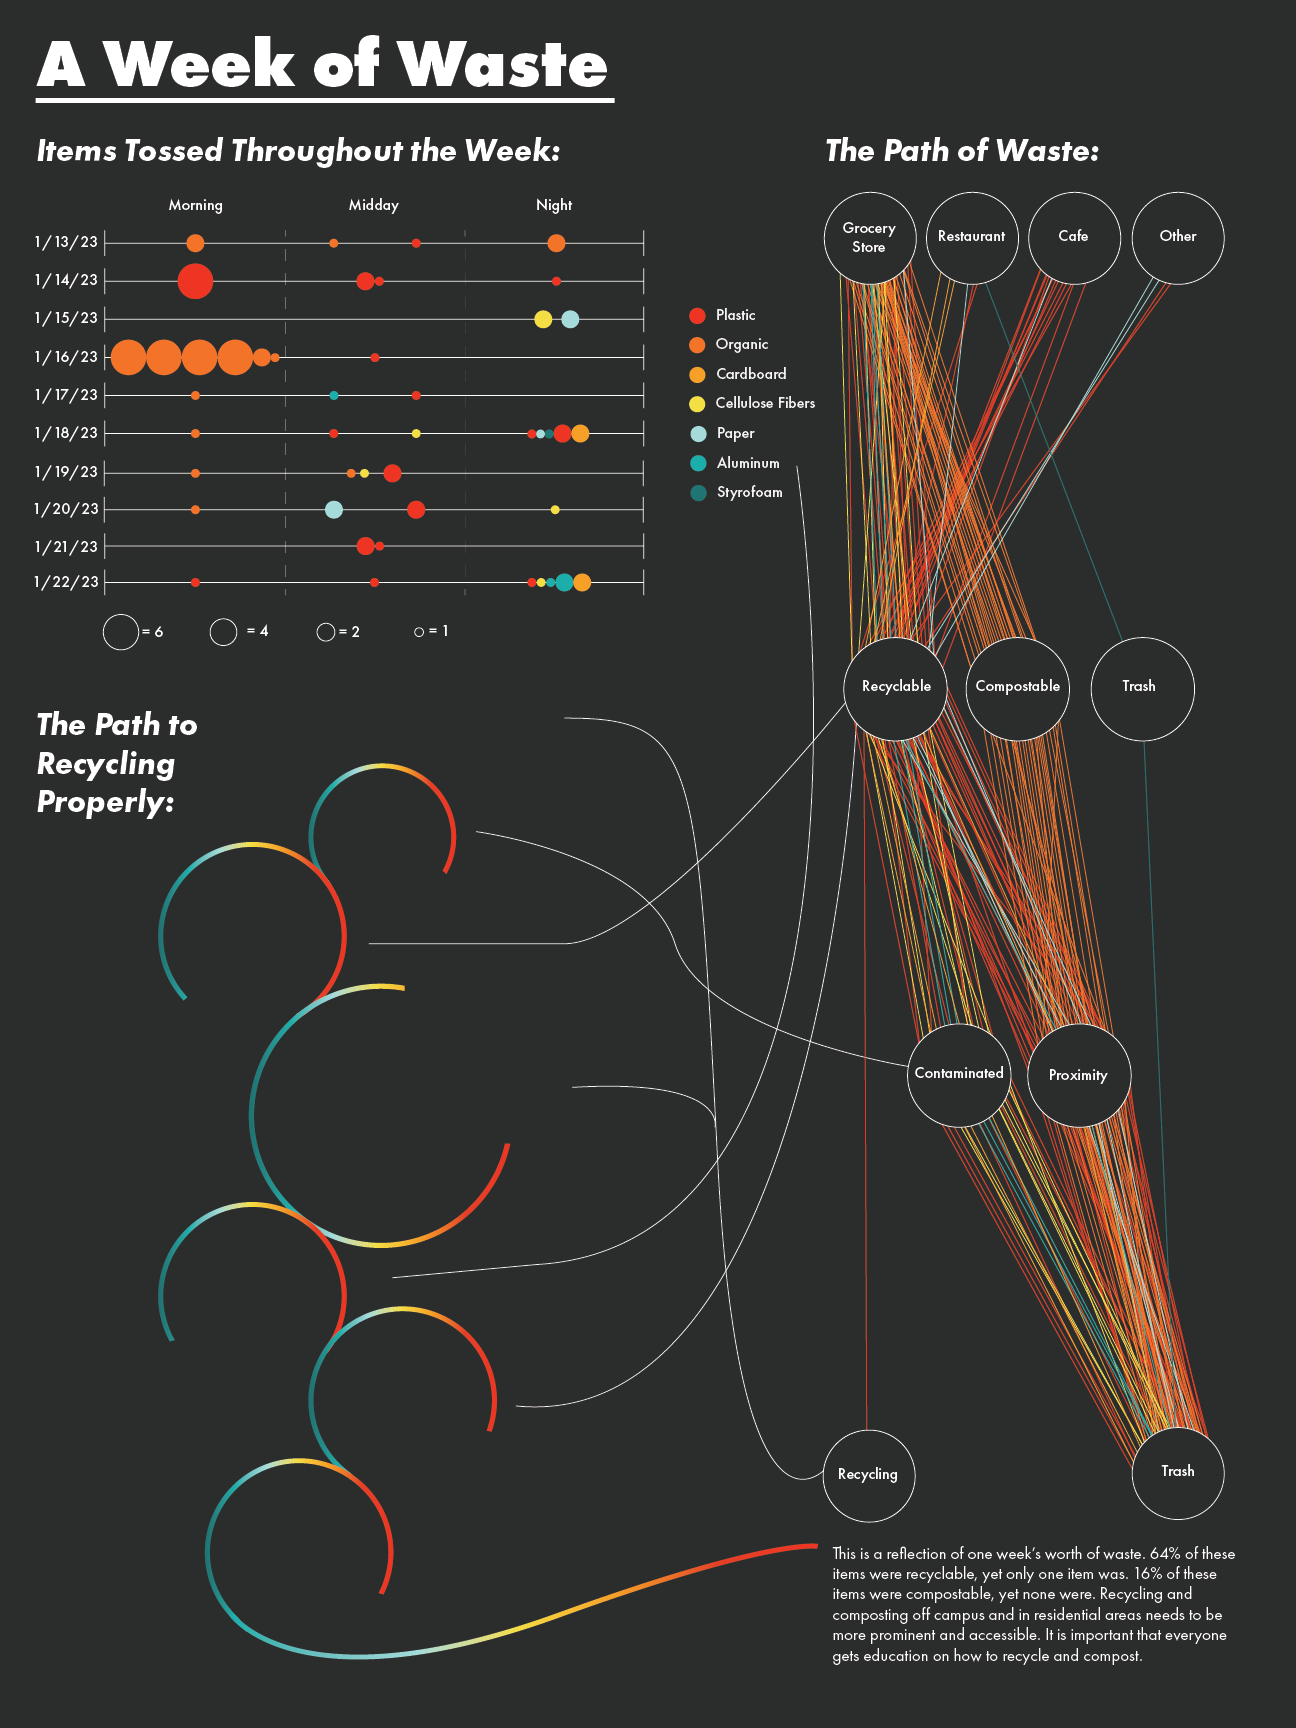
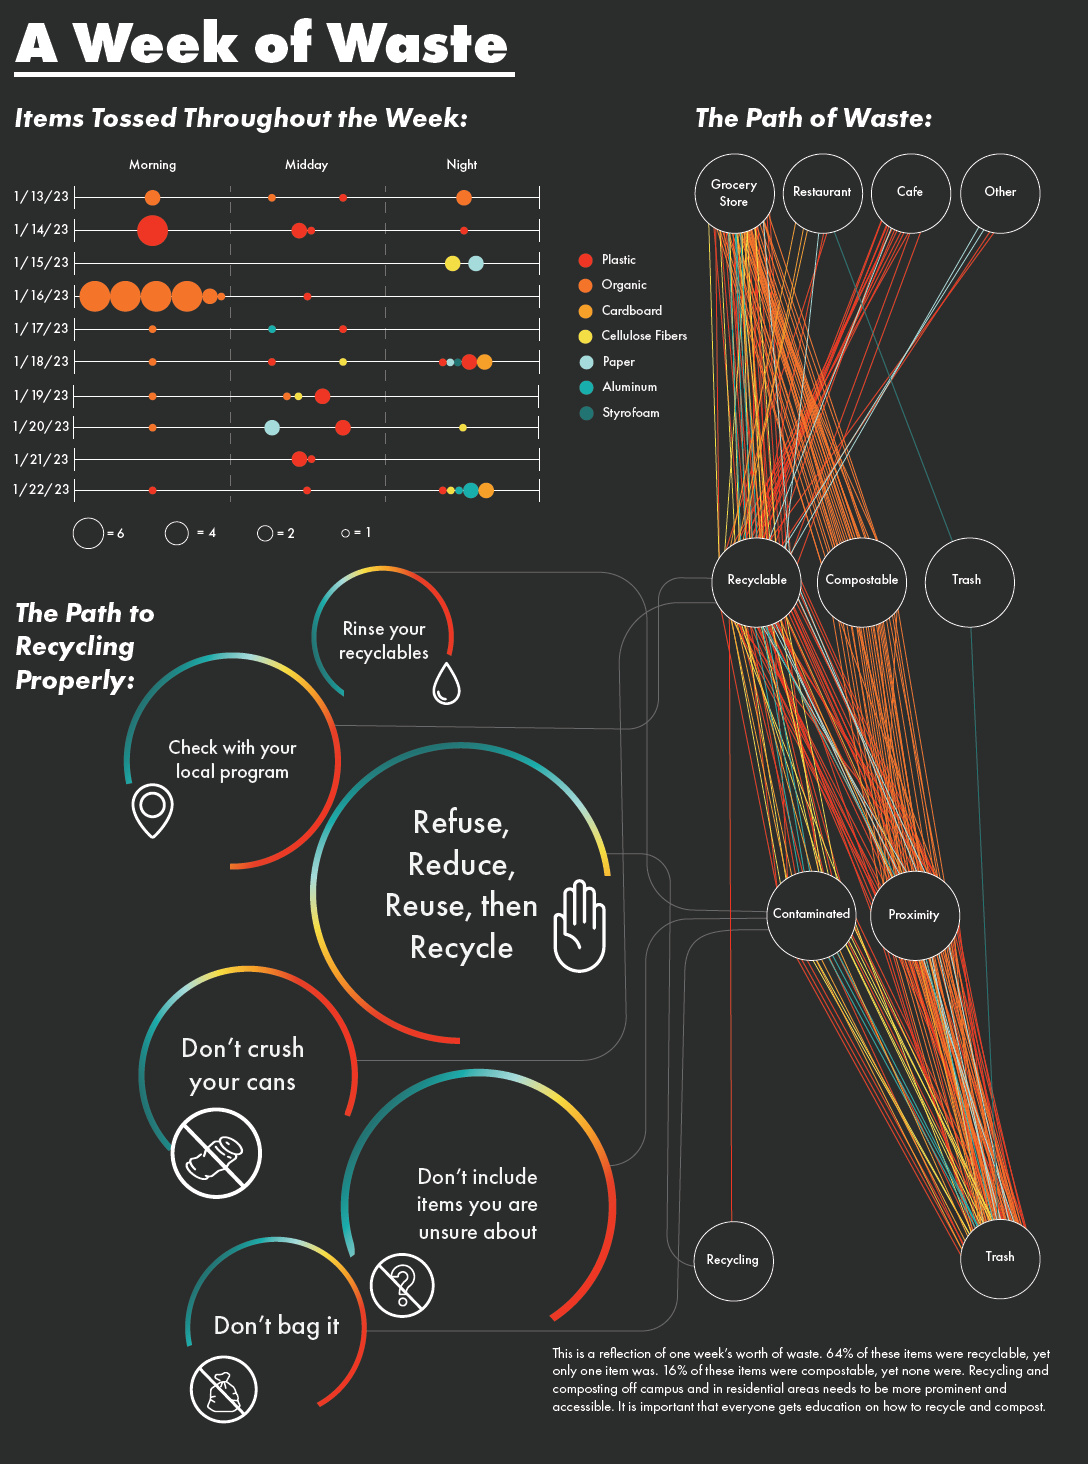
Over the course of a week, I recorded every item I disposed of in a spreadsheet. I categorized the items by date, time of day they were disposed of, quantity, origin location, length of possession in hours, main material, color, shape, if it was compostable or recyclable, disposed location, reasoning behind why an item was not recycled or reused, possible packaging alternatives, reusable alternatives, and utility value. This spreadsheet made it easier to see all of the data in one place and try different ways of organizing the data into different narratives.
Secondary Research:
I also collected secondary research, specifically on the do's and don't of recycling from Leave No Trace, an organization that strives to provide education, skills, research and science to protect the natural world. I found that while I was compiling my data, many of my items were recyclable, but I didn't understand how to recycle properly. I knew that this was supplemental information that I wanted to include in my final deliverable as it could help others.
Sketches & Feedback
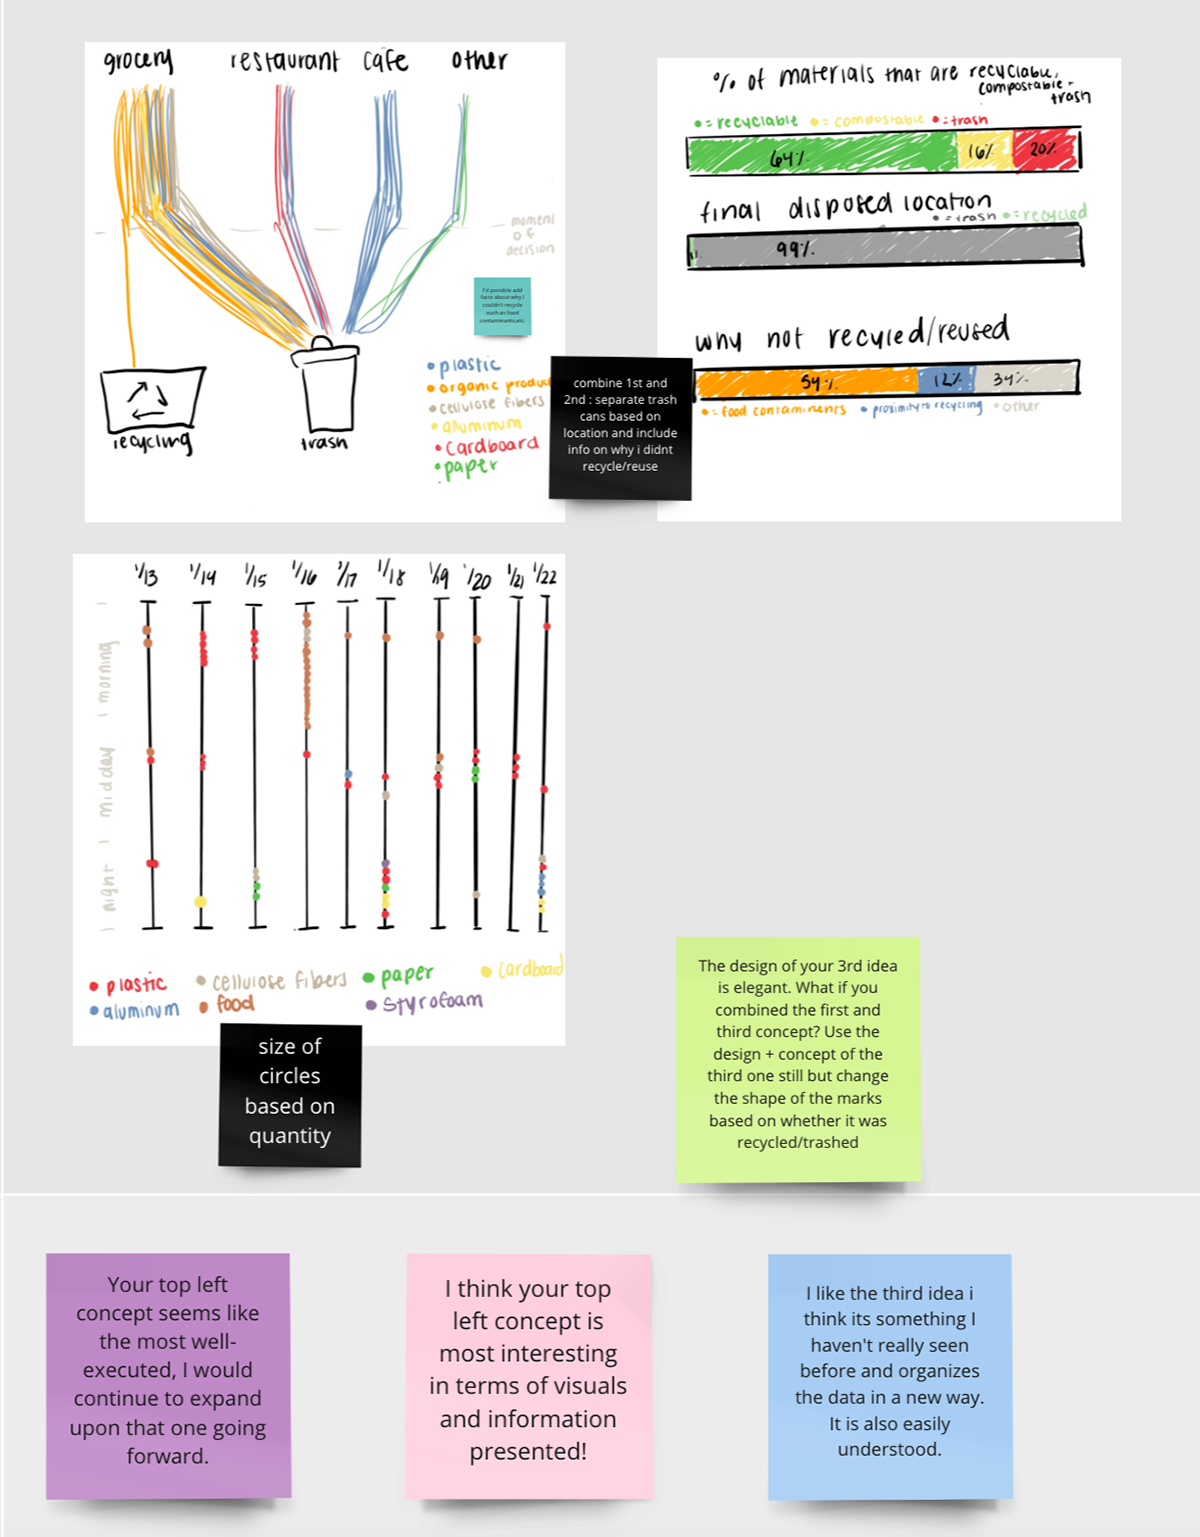
Initial Ideation of 3 Concepts
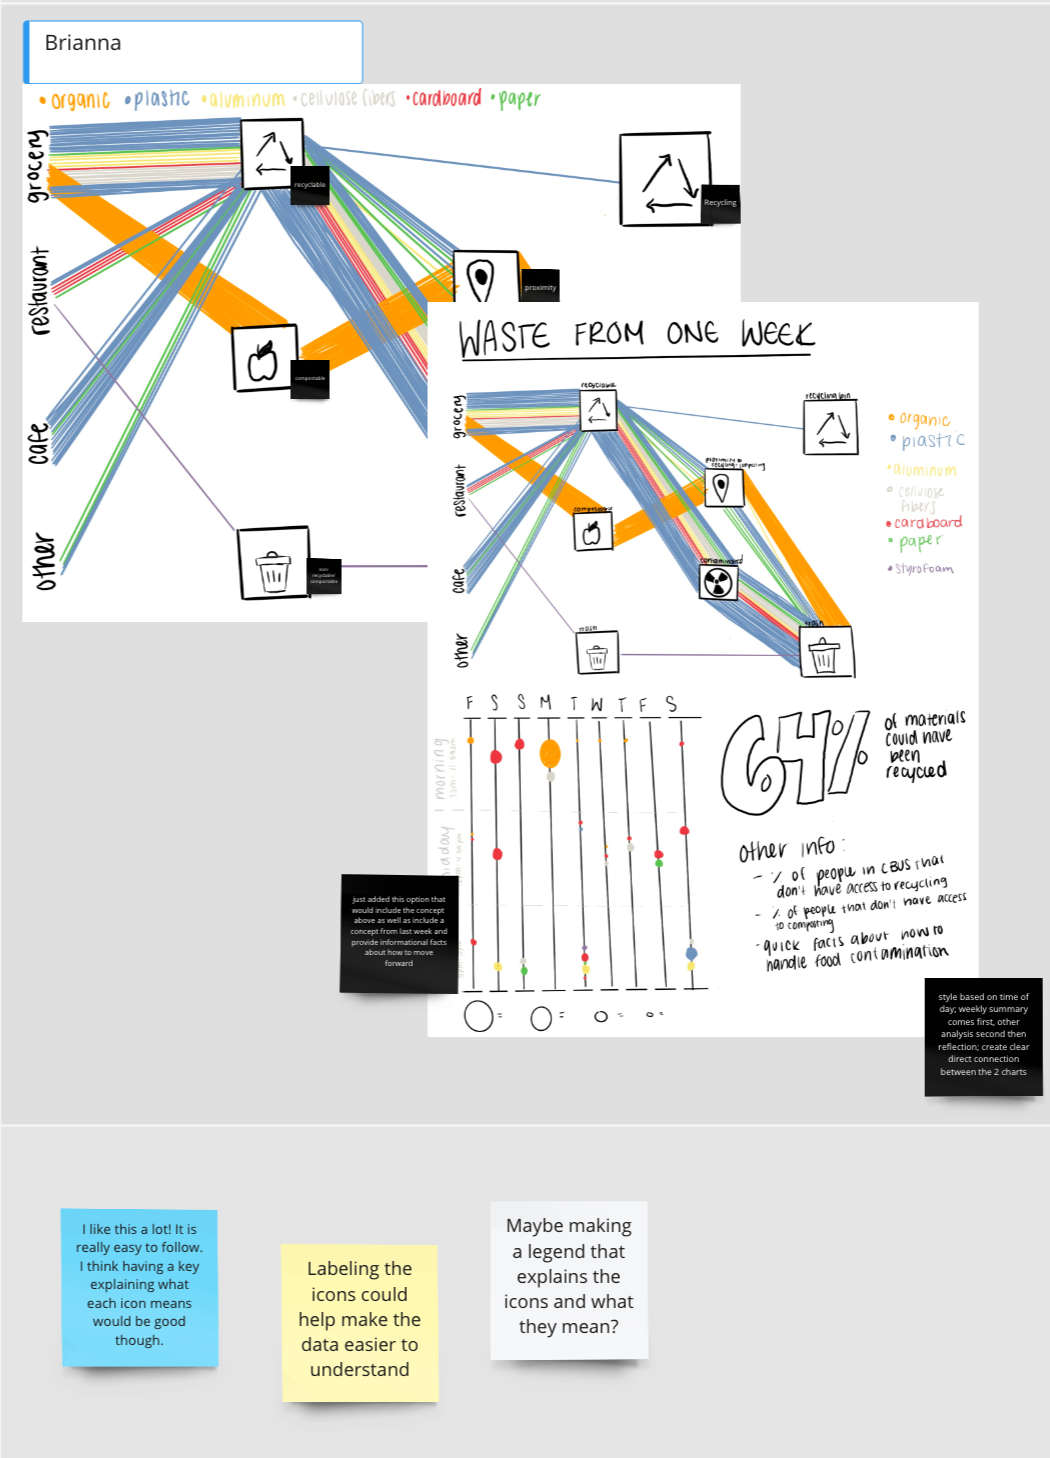
Updated Concept
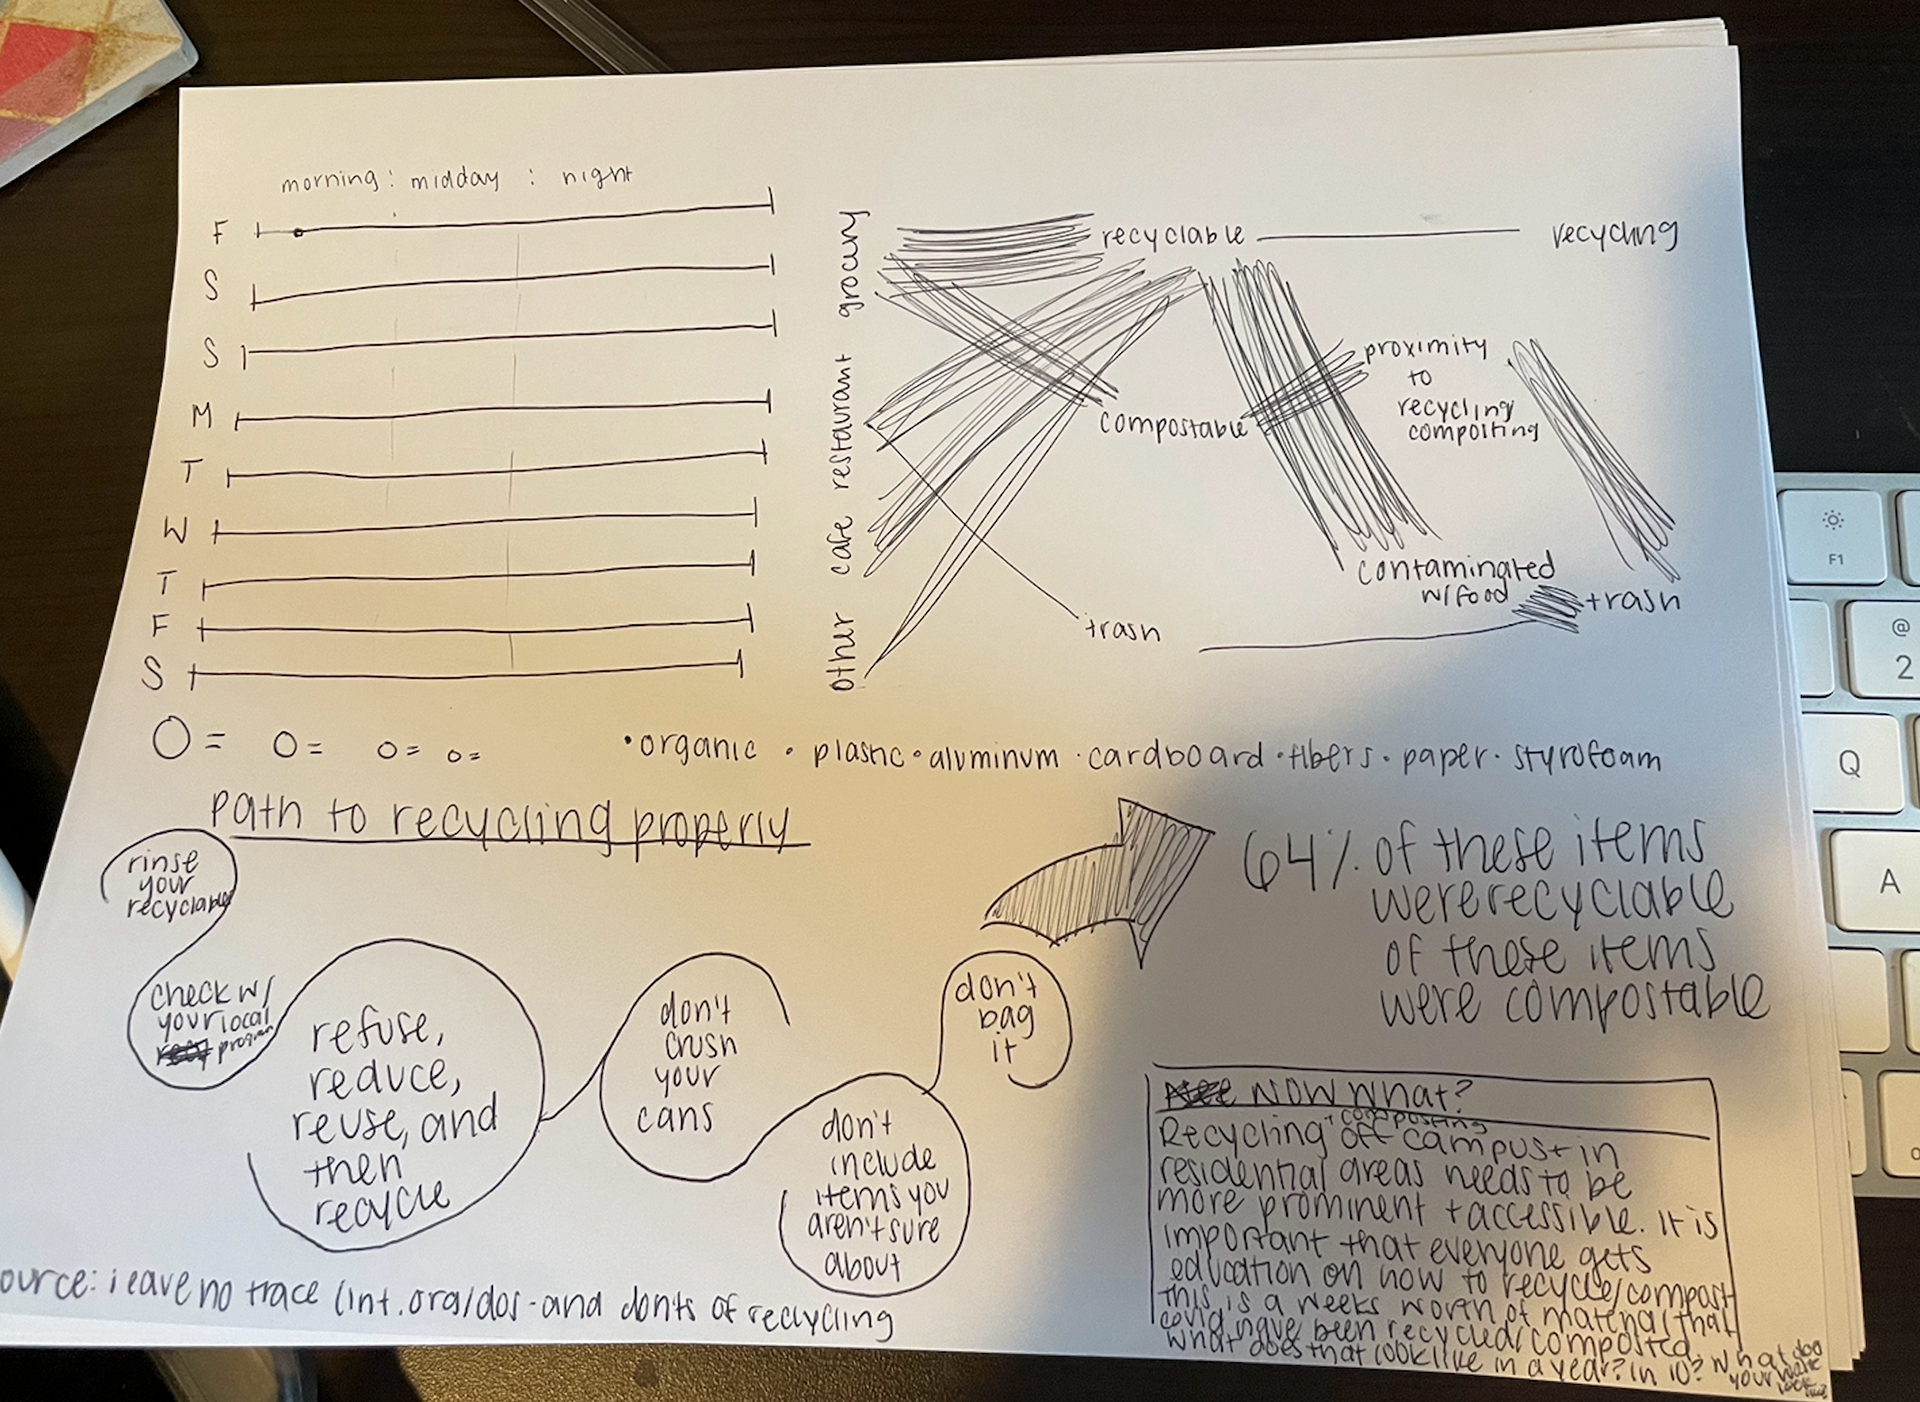
Planning of Digital Layout
Digital Layout Exploration
Updated Digital Layout Exploration
Final Deliverable
Reflection- What? So What? Now What?
Although I was aware that I was not recycling, I did not realize how much waste I was producing as an individual until I made the data into a graphic. Data visualization is a powerful tool that can be used to explain complex research and concepts. Organizing, filtering, and analyzing the data are extremely helpful skills that can be applied to many different contexts, especially User Experience design and market research.
As I collected data on all of the waste I produced over the course of a week, I was trying to understand my waste habits and why I don't recycle as much as I would like to. Only one item was recycled over the course of that week and it was only recycled because I was on campus. My apartment doesn't have recycling or composting so there is no where for me to dispose of my waste besides the trashcan. I also do not have a car on campus to drop off recycling and I did not have the knowledge on how to handle food contamination. Despite almost all of my waste being recyclable due to its material, it is clear that a lack of knowledge and proximity to recycling/composting resulted in only one item being recycled.
I knew I should have recycled a majority of my waste and cleared items of food contaminants. My actions were based on two main barriers: accessibility and education. Therefore, I chose to conduct secondary research on how to recycle properly to include in my final deliverable.
I personally value sustainability, but it is difficult when my apartment building doesn't have recycling and I do not have a vehicle to get to the recycling plant. I think it would be interesting to see what would happen if this same data was collected on the individuals in my apartment building. This research I conducted could be furthered explored in terms of accessibility to recycling resources and it brought to light so many other questions. How often would proximity be a barrier? How often would recyclable items be contaminated? Would this data change the way my apartment building handles recycling? What would happen if this data was collected on all of the individuals in Columbus? Would it follow a similar pattern?